Seed Markets
Thompson et al. (1998) estimated the demand for hemp seed by asking seed processing firms in the United States and Canada how many tons they pur- chased per month. They estimated North American demand at 1,300 tons at an average price of 39 cents per pound. Given yields in Germany of 1,000 pounds per acre, it would take 2,600 acres to satisfy the esti- mated demand for hemp seed. Ehrensing (1998) found bulk hemp seed prices at about 45 cents per pound, with strong demand. Hanks (Fall 1999) reports an average Canadian seed price of 41 cents per pound (60 cents Canadian) in 1999, but states that many observers fear overproduction of hemp in western Canada may bring crop prices down. In comparison, during the 1994/95-1998/99 marketing years, soybean, canola, and flaxseed prices averaged 10, 11, and 10 cents per pound, respectively (Ash, 1999).
According to Vantreese (1998), export prices of hemp seed have been extremely volatile in the last 20 years, mainly due to the variability of Chinese exports. China began producing and exporting hemp seed in large quantities in 1986, causing world prices to fall from 25 cents in 1985 to 15 cents per pound in 1986. In 1991, China stopped exporting hemp seed and prices nearly doubled in 1992. Prices peaked in 1995 at 41 cents a pound. During the 1990’s, increased EU production of hemp also increased the demand for seed stock for planting, thereby raising export values.
Hemp seeds can be used as a food ingredient or crushed for oil and meal. The seed contains 20 percent high-quality, digestible protein, which can be con- sumed by humans, animals, and birds (Vantreese, 1998). The seed is approximately 29 to 34 percent oil by weight. The oil can be used both for human con- sumption and industrial applications (fig. 2). Due to the high content of polyunsaturated oils, it is fairly unstable and becomes rancid quickly unless preserved. The meal (seed cake) contains 25 to 30 percent protein and can be used in food and animal feed (Vantreese, 1998; Hinz, 1999).
Companies are using hemp seed in their products. Natural-product magazines, such as the Natural Food Merchandiser and Organic & Natural News, have advertised products containing hemp ingredients such as roasted hulled seed, nutrition bars, tortilla chips, pretzels, and beer. At least two breweries in the United States, as well as breweries in Canada, Germany, and
Switzerland, make hemp beer (The Economist; Gardner and White; Louie, 1998). One article touts hulled hemp seeds as more shelf-stable than flax and more digestible than soybeans and finds the seed in snacks, spreads, salad dressings, cheese, and ice cream (Rorie, 1999). The market potential for hemp seed as a food ingredient is unknown. However, it probably will remain a small market, like those for sesame and poppy seeds. Some consumers may be willing to pay a higher price for hemp-seed-containing products because of the novelty, but otherwise hemp seed will have to compete on taste and functionality with more common food ingredients.
Currently, a trendy use of hemp oil is for body-care products, such as lotions, moisturizers, shampoos, and lip balms (Marshall, 1998; Rorie). For example, The Body Shop, a British-based international skin products company, began selling hemp-oil-containing products about 2 years ago in the United States. In June 1999, the company reported that those seven or eight prod- ucts now account for 10 percent of total sales. However, to meet this demand, The Body Shops imports only 12 tons of organic hemp seed oil a year into the United States (Patton).
Hemp oil is also sold in health food stores as a nutri- tional supplement. The oil is mechanically (cold) pressed from the seed to maintain its quality and integrity. According to one industry participant, cold- pressed hemp oil has a dark green color and nutty fla- vor (Hemp-Agro). It contains roughly the same ratio of linoleic and linolenic acids that would be found in a nutritionally balanced diet (Marshall, Hinz). In addi- tion to these two essential fatty acids, hemp oil con- tains 1 to 4 percent gamma-linolenic acid (GLA). GLA is also available from evening primrose and bor- age oils that, because of their unpleasant taste, are sold only in capsule form (Marshall, Hemp-Agro).
The market for hemp oil is limited by a number of fac- tors. First, mechanical crushing produces a lower oil yield than crushing combined with solvent extraction. Nor does hemp oil undergo degumming and bleaching as do many other vegetable oils. Some consumers pre- fer an oil that has been processed without chemicals, but others may dislike hemp oil’s color or taste. Second, the oil is high in unsaturated fatty acids, which can easily oxidize, so it must be kept in dark- colored bottles and has a limited shelf life. Like flax and safflower oils, which also are highly unsaturated,
Industrial Hemp in the United States USDA • 15
hemp Table 6—U.S. use of selected vegetable oils in
oil should not be used for frying. Third, to be industrial applications, 1978/79-19981
used as a salad oil, it will have to be tested by the U.S.
Year
2
and All oils
fats 3
Linseed oil Food and Drug Administration and found “generally recognized as safe.” In Canada, hemp foods are now regulated as novel foods, a legislative category devel- oped primarily for products containing genetically modified organisms (Hanks, Fall 1999).
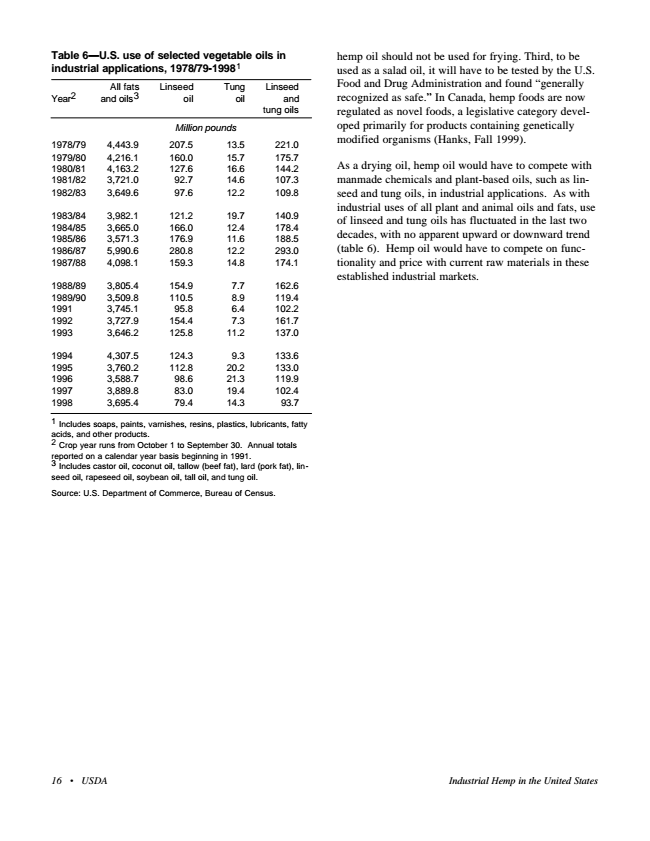
As a drying oil, hemp oil would have to compete with manmade chemicals and plant-based oils, such as lin- seed and tung oils, in industrial applications. As with industrial uses of all plant and animal oils and fats, use of linseed and tung oils has fluctuated in the last two decades, with no apparent upward or downward trend (table 6). Hemp oil would have to compete on func- tionality and price with current raw materials in these established industrial markets.
16 • USDA Industrial Hemp in the United States
Tung Linseed oil and tung oils
Million pounds
1978/79 4,443.9 207.5 13.5 221.0 1979/80 4,216.1 160.0 15.7 175.7 1980/81 4,163.2 127.6 16.6 144.2 1981/82 3,721.0 92.7 14.6 107.3 1982/83 3,649.6 97.6 12.2 109.8
1983/84 3,982.1 121.2 19.7 140.9 1984/85 3,665.0 166.0 12.4 178.4 1985/86 3,571.3 176.9 11.6 188.5 1986/87 5,990.6 280.8 12.2 293.0 1987/88 4,098.1 159.3 14.8 174.1
1988/89 3,805.4 154.9 7.7 162.6 1989/90 3,509.8 110.5 8.9 119.4 1991 3,745.1 95.8 6.4 102.2 1992 3,727.9 154.4 7.3 161.7 1993 3,646.2 125.8 11.2 137.0
1994 4,307.5 124.3 9.3 133.6 1995 3,760.2 112.8 20.2 133.0 1996 3,588.7 98.6 21.3 119.9 1997 3,889.8 83.0 19.4 102.4 1998 3,695.4 79.4 14.3 93.7
1
Includes soaps, paints, varnishes, resins, plastics, lubricants, fatty acids, 2
Crop and year other runs products.
from October 1 to September 30. Annual totals reported 3
Includes on castor a calendar oil, coconut year basis oil, tallow beginning (beef in fat), 1991.
lard (pork fat), lin- seed oil, rapeseed oil, soybean oil, tall oil, and tung oil.
Source: U.S. Department of Commerce, Bureau of Census.
No comments:
Post a Comment