""

Search This Blog

Saturday, May 2, 2015

Hemp Seed Report

Seed Markets
Thompson et al. (1998) estimated the demand for hemp seed by asking seed processing firms in the United States and Canada how many tons they pur- chased per month. They estimated North American demand at 1,300 tons at an average price of 39 cents per pound. Given yields in Germany of 1,000 pounds per acre, it would take 2,600 acres to satisfy the esti- mated demand for hemp seed. Ehrensing (1998) found bulk hemp seed prices at about 45 cents per pound, with strong demand. Hanks (Fall 1999) reports an average Canadian seed price of 41 cents per pound (60 cents Canadian) in 1999, but states that many observers fear overproduction of hemp in western Canada may bring crop prices down. In comparison, during the 1994/95-1998/99 marketing years, soybean, canola, and flaxseed prices averaged 10, 11, and 10 cents per pound, respectively (Ash, 1999).
According to Vantreese (1998), export prices of hemp seed have been extremely volatile in the last 20 years, mainly due to the variability of Chinese exports. China began producing and exporting hemp seed in large quantities in 1986, causing world prices to fall from 25 cents in 1985 to 15 cents per pound in 1986. In 1991, China stopped exporting hemp seed and prices nearly doubled in 1992. Prices peaked in 1995 at 41 cents a pound. During the 1990’s, increased EU production of hemp also increased the demand for seed stock for planting, thereby raising export values.
Hemp seeds can be used as a food ingredient or crushed for oil and meal. The seed contains 20 percent high-quality, digestible protein, which can be con- sumed by humans, animals, and birds (Vantreese, 1998). The seed is approximately 29 to 34 percent oil by weight. The oil can be used both for human con- sumption and industrial applications (fig. 2). Due to the high content of polyunsaturated oils, it is fairly unstable and becomes rancid quickly unless preserved. The meal (seed cake) contains 25 to 30 percent protein and can be used in food and animal feed (Vantreese, 1998; Hinz, 1999).
Companies are using hemp seed in their products. Natural-product magazines, such as the Natural Food Merchandiser and Organic & Natural News, have advertised products containing hemp ingredients such as roasted hulled seed, nutrition bars, tortilla chips, pretzels, and beer. At least two breweries in the United States, as well as breweries in Canada, Germany, and
Switzerland, make hemp beer (The Economist; Gardner and White; Louie, 1998). One article touts hulled hemp seeds as more shelf-stable than flax and more digestible than soybeans and finds the seed in snacks, spreads, salad dressings, cheese, and ice cream (Rorie, 1999). The market potential for hemp seed as a food ingredient is unknown. However, it probably will remain a small market, like those for sesame and poppy seeds. Some consumers may be willing to pay a higher price for hemp-seed-containing products because of the novelty, but otherwise hemp seed will have to compete on taste and functionality with more common food ingredients.
Currently, a trendy use of hemp oil is for body-care products, such as lotions, moisturizers, shampoos, and lip balms (Marshall, 1998; Rorie). For example, The Body Shop, a British-based international skin products company, began selling hemp-oil-containing products about 2 years ago in the United States. In June 1999, the company reported that those seven or eight prod- ucts now account for 10 percent of total sales. However, to meet this demand, The Body Shops imports only 12 tons of organic hemp seed oil a year into the United States (Patton).
Hemp oil is also sold in health food stores as a nutri- tional supplement. The oil is mechanically (cold) pressed from the seed to maintain its quality and integrity. According to one industry participant, cold- pressed hemp oil has a dark green color and nutty fla- vor (Hemp-Agro). It contains roughly the same ratio of linoleic and linolenic acids that would be found in a nutritionally balanced diet (Marshall, Hinz). In addi- tion to these two essential fatty acids, hemp oil con- tains 1 to 4 percent gamma-linolenic acid (GLA). GLA is also available from evening primrose and bor- age oils that, because of their unpleasant taste, are sold only in capsule form (Marshall, Hemp-Agro).
The market for hemp oil is limited by a number of fac- tors. First, mechanical crushing produces a lower oil yield than crushing combined with solvent extraction. Nor does hemp oil undergo degumming and bleaching as do many other vegetable oils. Some consumers pre- fer an oil that has been processed without chemicals, but others may dislike hemp oil’s color or taste. Second, the oil is high in unsaturated fatty acids, which can easily oxidize, so it must be kept in dark- colored bottles and has a limited shelf life. Like flax and safflower oils, which also are highly unsaturated,
Industrial Hemp in the United States USDA • 15
hemp Table 6—U.S. use of selected vegetable oils in
oil should not be used for frying. Third, to be industrial applications, 1978/79-19981
used as a salad oil, it will have to be tested by the U.S.
Year
2
and All oils
fats 3
Linseed oil Food and Drug Administration and found “generally recognized as safe.” In Canada, hemp foods are now regulated as novel foods, a legislative category devel- oped primarily for products containing genetically modified organisms (Hanks, Fall 1999).
As a drying oil, hemp oil would have to compete with manmade chemicals and plant-based oils, such as lin- seed and tung oils, in industrial applications. As with industrial uses of all plant and animal oils and fats, use of linseed and tung oils has fluctuated in the last two decades, with no apparent upward or downward trend (table 6). Hemp oil would have to compete on func- tionality and price with current raw materials in these established industrial markets.
16 • USDA Industrial Hemp in the United States
Tung Linseed oil and tung oils
Million pounds
1978/79 4,443.9 207.5 13.5 221.0 1979/80 4,216.1 160.0 15.7 175.7 1980/81 4,163.2 127.6 16.6 144.2 1981/82 3,721.0 92.7 14.6 107.3 1982/83 3,649.6 97.6 12.2 109.8
1983/84 3,982.1 121.2 19.7 140.9 1984/85 3,665.0 166.0 12.4 178.4 1985/86 3,571.3 176.9 11.6 188.5 1986/87 5,990.6 280.8 12.2 293.0 1987/88 4,098.1 159.3 14.8 174.1
1988/89 3,805.4 154.9 7.7 162.6 1989/90 3,509.8 110.5 8.9 119.4 1991 3,745.1 95.8 6.4 102.2 1992 3,727.9 154.4 7.3 161.7 1993 3,646.2 125.8 11.2 137.0
1994 4,307.5 124.3 9.3 133.6 1995 3,760.2 112.8 20.2 133.0 1996 3,588.7 98.6 21.3 119.9 1997 3,889.8 83.0 19.4 102.4 1998 3,695.4 79.4 14.3 93.7
1
Includes soaps, paints, varnishes, resins, plastics, lubricants, fatty acids, 2
Crop and year other runs products.
from October 1 to September 30. Annual totals reported 3
Includes on castor a calendar oil, coconut year basis oil, tallow beginning (beef in fat), 1991.
lard (pork fat), lin- seed oil, rapeseed oil, soybean oil, tall oil, and tung oil.
Source: U.S. Department of Commerce, Bureau of Census.

Hemp potential US Production and Processing

Potential U.S. Production and Processing

Potential yields and processing methods, along with farmer costs and returns, are important considerations when evaluating industrial hemp as a potential U.S. crop. Revenue is dependent on yields and market prices. Generally, the lower the market price, the greater the yield must be for producers to break even or make a profit. In addition, U.S. experience with kenaf and flax may lend insights into the processing hurdles hemp may face in the United States.

Possible Yields

The Oregon study summarizes hemp yields reported by researchers from various countries since the 1900’s (Ehrensing). Early in this century, U.S. dry-stem yields ranged from 2 to 12.5 tons per acre, but averaged 5 tons per acre under good conditions. Research trials in Europe during the last four decades had dry-matter yields that ranged from 3.6 to 8.7 tons per acre. In the Netherlands, research trials during the late 1980’s reported dry-stem yields of 4.2 to 6.1 tons per acre. Recent commercial production in England produced average dry-matter yields of 2.2 to 3 tons per acre on several thousand acres over several years. Experimental production in Canada during 1995 and 1996 yielded 2.5 to 3 tons of dry stems per acre. According to the study, some of the variation in yield

can be attributed to different measurement practices. For example, European authors generally report total above-ground dry matter, including stems, leaves, and seed, versus the dry-stem yields reported by other researchers.

Vantreese (1998) reports that hemp seed yields have increased dramatically in recent years. In 1997, world average yields reached 876 pounds per acre. Yields ranged significantly, from a high of 1,606 pounds per acre in China, where the seed is consumed, to 595 pounds per acre in France, where much of the produc- tion is certified planting seed. In Germany, current seed yields are about 1,000 pounds per acre (Thompson et al.), while those in Eastern Europe range from 350 to 450 pounds per acre (Mackie, 1998). In Canada, seed yields in 1999 averaged 800 pounds per acre (Hanks, Fall 1999).

Processing

In addition to the uncertainty about yields, there is some question as to whether hemp fibers can be prof- itably processed in the United States. As was outlined earlier, the technologies used to process hemp fiber have not changed much and they require capital investment and knowledgeable workers. Research is under way to streamline harvesting, retting, and fiber separation, but those technological breakthroughs have yet to occur. Traditional retting and fiber-separation

Table 7—Estimated enterprise costs for hemp production in Kentucky, 1994

Costs Fiber

1

Seed Certified seed

Dollars/acre

Variable costs: Seed (pounds) (40) 80.00 (10) 20.00 (10) 20.00 Fertilizer 33.58 33.58 33.58 Lime (tons) (1) 10.82 (1) 10.82 (1) 10.82 Fuel, oil (hours) (4.5) 16.02 (2.2) 12.22 (2.2) 12.22 Repairs 9.35 17.60 17.60 Interest 7.93 4.24 4.24 Total 184.12 98.46 98.46

Fixed costs

2

46.08 41.25 64.84

Operator labor

3

(hours) (8) 56.00 (8) 56.00 (10) 70.00

Total enterprise costs 286.20 195.71 233.30 1 2

Harvested Depreciation, and taxes, sold as insurance.

raw stalks.

3

At $7 per hour.

Source: McNulty.

Industrial Hemp in the United States USDA • 17

were processes—both labor and resource intensive—could

comparable to 1993 estimated expenses for pro- limit the ability of U.S. hemp producers to compete

ducing corn and double-crop wheat/soybeans in against major suppliers such as China, Hungary,

Kentucky (table 8). The analysis assumed that hemp Poland, and Romania.

grown for fiber would be harvested and sold as raw stalks on a dry-weight basis. Various sources priced Specialty oilseed crushing mills that could accommo-

raw, dry defoliated stalks at $60 to $125 per metric date hemp seed do exist in the United States.

ton. Yields were assumed to range from 7 to 15 metric According to the Soya & Oilseed Bluebook, companies

tons per hectare (2.8-6.1 metric tons per acre), based in North Dakota, Minnesota, Georgia, and North

largely on European studies. Thus, potential returns Carolina mechanically crush flaxseed, borage, saf-

for hemp fiber ranged from a low price/low yield esti- flower, canola, sunflowerseed, crambe, peanuts, and

mate of $170 per acre to a high price/high yield return cottonseed (Soyatech, 1999).

of $759 per acre (table 8). With estimated production expenses of $286, net returns for hemp for fiber Estimated Costs and Returns

ranged from -$116 to $473 per acre. Returns for hemp seed were estimated to range from $60 to $800 per Both the 1995 Kentucky Task Force report (McNulty)

acre. Given costs of production at $196 per acre, net and the 1998 Kentucky impact analysis (Thompson et

returns ranged from -$136 to $604 per acre (McNulty). al.), as well as the Oregon and North Dakota studies (Ehrensing, Kraenzel et al.), present estimated costs

The Oregon report also estimated costs and returns for and returns for hemp production. All include esti-

hemp grown for fiber, using typical costs associated mates for fiber (stalk) production. The 1995

with irrigated field corn in the Pacific Northwest (table Kentucky, 1998 Kentucky, and North Dakota reports

9). Variable and fixed costs for hemp were estimated also present estimates on seed production. In addition,

at $371 and $245 per acre, respectively. The dry-mat- most of the studies compare the estimated hemp costs

ter yield was assumed to be 5 tons per acre, which is and returns to those for other crops.

consistent with the higher average yields reported in Western Europe using well-adapted cultivars. A price The Kentucky Task Force estimated total costs—

of $75 per dry ton was based on the price of wood which include variable costs, fixed costs, and operator

chips in the Pacific Northwest, as it was anticipated labor—to be $286 per acre for hemp fiber, $196 for

that the fiber could be used by local composite and seed, and $233 for certified seed (table 7). These costs

paper companies. Given this yield and price, gross

Table 8—Estimated costs of production and returns for various crops in Kentucky, 1993 or 1994

Estimated cost per acre

Crop

1

Return Net return Yield per acre per acre Variable Fixed Labor Total per acre

Dollars

Fiber hemp

2

2.8-6.1 metric 170-759 184 46 56 286 -116 to 473

tons

Hemp seed

3

na 60-800 98 41 56 196 -136 to 604

Corn grain 110 bushels 231 155 46 32 233 -2

Wheat/soybeans

(double crop) 45/28 bushels 300 149 44 37 230 70

Tomatoes

(for processing) 27 tons 2,430 1,278 154 231 1,663 767

Burley tobacco 2,500 pounds 4,375 1,905 626 700 3,231 1,144

na 1 2 3

Various For One = Not all source crops available. sources estimated except priced hemp, returns dry, 18 • USDA Industrial Hemp in the United States

source is University of Kentucky, Department defoliated stalks at $60 to $125 per metric at $60 to $171 per acre for seed (for oil of Agricultural ton.

and feed), while Economics crop budgets for 1993.

another estimated seed returns at $800 per acre (2,000 pounds per acre at 40 cents per pound). Source: McNulty.

revenue Table 9—Estimated production budget for hemp in

would be $375 per acre and net returns would the Pacific Northwest1

be -$241 per acre (Ehrensing).

Item Dollars/ton Dollars/acre (dry weight)

The Oregon report presents a sensitivity analysis of net

Variable costs: Cultural

Tillage and planting 40.00 returns based on various yields and potential market

prices (table 10). Most of the net returns remain nega- 8.00

tive except under the highest yield/price combinations. Hemp Fertilizer seed and application

3

34.00 85.00 6.80

The analysis was further refined to see if dual produc-

Irrigation 62.00 Total 221.00 Harvest

4 Forage chopper ($3/ton) 15.00 Raking ($1.50/ton) 7.50 Baling, large square

17.00 12.40 44.20

tion was any more profitable. The cost of combine seed harvest, $20 per acre, was added to variable costs, and stalk yields were lowered to 2.5 tons per

3.00 1.50

acre with a price of $75 per ton. Again, most of the net returns are negative except for the highest yield/price combinations (table 11) (Ehrensing). bales ($9.80/ton) 49.00 9.80 Loading and trucking

The 1998 Kentucky report estimates costs and returns ($3.00/ton) Total 15.00 86.50 3.00 12.80

for hemp grown for fiber (straw), seed (grain), certified seed, and both fiber and seed (table 12). The cost esti- Miscellaneous

Operating capital interest 29.78 Pickup 7.68 Farm truck 6.34 General overhead 20.00 5.96 1.54 1.27 4.00

Table 10—Estimated net return per acre from hemp production in the Pacific Northwest at various price and yield levels

Total 63.80 12.76

Yield (tons

Price (dollars/ton) Total variable costs 371.30 69.76

per acre) 50 75 100 125 Fixed costs:

Dollars/acre Land rent 150.00 30.00

Insurance, machinery

and equipment 3.00 0.60 Irrigation system, depre-

ciation and interest 44.00 8.80 Machinery and equipment,

3 -431.70 -356.70 -281.70 -206.70 4 -399.00 -299.00 -199.00 -99.00 5 -366.30 -241.30 -116.30 8.70 6 -333.60 -183.60 -33.60 116.40 7 -300.90 -125.90 49.10 224.10 depreciation and interest 48.00 9.60 Total 245.00 49.00

Source: Ehrensing.

Total production costs 616.30 118.76

Gross (yield = income

5 tons/acre)

5

375.00 75.00

Net projected returns -241.30 -43.76

Table 11—Estimated net return per acre from dual- purpose hemp production in the Pacific Northwest at various seed prices and yield levels1 1

Budget was developed using typical costs associated with irrigat- ed field corn in the Pacific Northwest. Production practices were chosen to maximize stem dry-weight yield for possible production of composite wood products or paper.

Seed price (dollars/pound) Seed yield (pounds/acre) 2

25 pounds/acre at

500 750 1000 $1.36/pound. The assumed cost of hemp seed is the average of prices Cost 16-16-16 of reported shipping at $250/ton.

for from commercially Europe 4

Based was on available not cost included.

of operating European 3

600 silage hemp pounds/acre corn varieties. har-

0.30 0.35 Dollars/acre

-255 -181 -106 -231 -143 -56 vesters and local cost of raking and baling hay and grass seed

0.40 -206 -106 -6 straw. are included.

No costs 5

The associated dry matter with yield retting, is assumed such as additional to be 5 tons/acre,

irrigation,

which is consistent with the higher average yields reported in Western Europe using well-adapted hemp cultivars. An assumed price of $75 per dry ton was used in the analysis since prices for

0.45 -181 -68 45 0.50 -156 -31 94 0.55 -131 7 144 1

The cost of combine seed harvest, $20 per acre, was added to wood chips in the Pacific Northwest have risen over the past decade

variable costs. Hemp stem yield was assumed to be 2.5 tons per and this trend is expected to continue.

acre with a price of $75 per ton. Other assumptions are the same

Source: Ehrensing.

as those used for table 9.

Source: Ehrensing.

Industrial Hemp in the United States USDA • 19

admit mates are based on the 1995 Kentucky report and

that the very high returns calculated in these updated to 1997 with some modifications. The yields

estimates cannot be sustained. While most of their used in the analysis are from Germany. The prices,

discussion focuses on why the price of certified seed based on import prices and/or prices paid in Canada,

will decrease, little attention is given to stalk prices. were estimated to be 39 cents per pound for seed, $1.20

The price they used for stalks is the first-year (1998) per pound for certified seed for planting, and $200 per

price offered by Kenex Ltd., the Ontario firm contract- ton for hemp stalks. The residual stalks from seed pro-

ing for hemp acreage, which is not representative of duction were estimated to fetch $120 per ton. Total

long-term stalk prices. With new crops, firms often costs ranged from $257 to $403 per acre. According to

have to offer farmers an initial premium to induce the report, these cost estimates are consistent with

them to experiment with a new crop and to compen- those made by Reichert (1994), by Kenex Ltd., and

sate them for lower initial yields and the forgone from German cultivation data (Thompson et al.).

returns of a conventional crop. Thus, many of the rev- enue estimates likely overstate average annual returns. Estimated revenue ranges from $477 per acre for seed

Given the high estimates, it is not surprising that when to $900 per acre for certified seed. Thompson et al.

compared with conventional field crops, hemp net

20 • USDA Industrial Hemp in the United States

Table 12—Estimated growing costs and returns for industrial hemp in Kentucky using 1997 technology, yields, and, prices1

Item Fiber

2

Seed

2

Certified seed Fiber and seed

2

Dollars/acre

Variable costs: Seed (pounds) (50) 125.00 (10) 25.00 (10) 25.00 (50) 125.00 Fertilizer 45.01 45.01 45.01 45.01 Herbicides 0.00 10.95 10.95 0.00 Lime (tons) (1) 12.12 (1) 12.12 (1) 12.12 (1) 12.12 Fuel, oil (hours) (4.5) 18.43 (2.2) 14.06 (2.2) 14.06 (2.2) 22.25 Repair 16.14 30.38 30.38 23.12 Interest 8.38 5.24 5.24 8.94 Storage 5.00 5.00 5.00 5.00 Transport to processor 27.20 8.00 5.60 24.00 Total 257.28 155.76 153.36 265.44

Fixed costs

3

50.27 45.00 70.73 75.05

Operator labor

4 (hours) (8) 56.00 (8) 56.00 (10) 70.00 (9) 63.00

Total enterprise costs 363.55 256.76 294.09 403.49

Stalk revenue 680.00 60.00 60.00 450.00 Stalk yield 3.4 tons/acre 0.5 tons/acre 0.5 tons/acre 2.25 tons/acre Price per ton 200/ton 120/ton 120/ton 200/ton

Seed revenue na 416.91 840.00 273.00 Seed yield na 1,069 lbs/acre 700 lbs/acre 700 lbs/acre Price per pound na 0.39/pound 1.20/pound 0.39/pound

Total revenue 680.00 476.91 900.00 723.00

Profit 316.45 220.15 605.91 319.51

na 1

Figures = Not applicable.

are based on estimates in McNulty (1995) and updated to 1997 based on the increased costs of growing corn. Also, herbicide, stor- age, and transport-to-processor costs were added; estimates for repair were increased by 50 percent; 50 pounds of hemp seed per acre were assumed 2 3 4

for cultivating hemp for fiber rather than 40 pounds. Referred to in the report as straw and grain. Fixed costs include depreciation, taxes, and insurance. At $7 per hour.

Source: Thompson et al.

basis Table 13—Estimated returns to land, capital, and

for the three price/yield scenarios. Prices ranged management per acre for industrial hemp and

from $5.51 to $6.80 per bushel for seed and from common Kentucky crops, 1997

$40.44 to $51.45 per ton for fiber (table 14). Yield

Crop Estimated return to land,

estimates ranged from 14.3 to 23.8 bushels of seed per capital, and management

acre and 2.5 to 3 tons of fiber per acre. Total costs

Hemp, seed only Hemp, fiber only Hemp, seed and fiber Hemp, certified seed only Dollars/acre 220.15 316.45 319.51 605.91

were estimated at $175 per acre, while potential rev- enue ranged from $180 to $316 per acre, resulting in net returns of $5 to $142 per acre. The return for the low-price/low-yield hemp scenario was comparable to those for most of the comparison crops in the study.

Grain sorghum, conventional tillage Wheat, reduced tillage 10.51 14.24

Only irrigated potatoes had higher net returns than any of the three hemp scenarios (Kraenzel et al.). Continuous corn 75.71 Popcorn, reduced tillage 78.25

Among the studies, total costs ranged from $175 for Soybeans, no-till, rotation following crop No-till corn, rotation following soybeans White corn, rotation following soybeans, reduced tillage Alfalfa hay 102.20 106.48

North Dakota to $616 in Oregon (table 15). A lot of the variation can be attributed to differences in fixed

135.84 141.34

costs. For example, fixed costs in the Kentucky stud- ies, which do not include land rent, are estimated at Barley/no-till soybeans, double-crop

$75 per acre or below. In the Oregon report, fixed following corn Wheat/no-till soybeans, double-crop following corn Grass legume hay, round bales Dark air-cured tobacco 158.09

costs are $245 per acre, including land rent and irriga-

158.43 161.56 182.48

tion-system depreciation. When land and irrigation costs are removed, fixed costs drop to $51. Also, when land rents, estimated at $65 to $75 (Vantreese, person- Dark fire-cured tobacco 1,104.87

al communication), are added to the Kentucky esti- Burley tobacco, baled, nonirrigated 1,563.48

mates, fixed costs range from $106 to $150. The esti-

Source: Thompson et al.

mates also may differ due to varying assumptions

returns were higher than those for all the selected crops except tobacco (table 13).

about production practices and may reflect different cost structures among the States. The Oregon study did cite high land costs as one reason hemp production

The costs and returns in the North Dakota report are based on a dual-purpose crop in Ontario, Canada.

may not be viable in the Pacific Northwest (Ehrensing).

Information from Vantreese (1997) was used as the

Table 14—Estimated costs and returns for hemp and other crops in North Dakota, 1998

Crop Average yield Average price Total revenue Total costs Net returns

Per acre Dollars/unit ------------------Dollars/acre-------------------

Low-price/low-yield hemp

1

14.3 bushels; $5.51/bushel; 179.96 174.63 5.33

Average hemp

1

2.5 tons $40.44/ton 19 bushels; $6.16/bushel; 248.13 174.63 73.49

High-price/high-yield hemp

1

2.75 tons $45.96/ton 23.8 bushels; $6.80/bushel; 316.29 174.63 141.65

3 tons $51.47/ton

Corn grain

2 Spring wheat

2

54 bushels 2.25 121.50 159.70 -38.20

Confectionery Malting Irrigated barley

potatoes

2 sunflowers

2

Industrial Hemp in the United States USDA • 21

2

31 bushels 3.71 115.01 117.32 -2.31 1,080 pounds 0.131 141.48 140.62 0.86 50 bushels 2.41 120.50 115.02 5.48 32,500 pounds 0.045 1,462.50 1,017.59 444.91

1 2

Estimates From projected are for 1998 a dual-purpose crop budgets crop for in Ontario, Canada.

Northeast North Dakota.

Source: Kraenzel et al.

Table 15—Comparison of estimated costs and returns for hemp from the various State studies

Report Variable Fixed costs

1

Operator Total costs Revenue Net returns costs labor

Dollars/acre

1995 Kentucky:

Fiber 184 46 56 286 170 to 759 -116 to 473 Seed 98 41 56 196 60 to 800 -136 to 604 Certified seed 98 65 70 233 na na

Oregon:

Fiber 371 245 na 616 375 -241

1998 Kentucky:

Fiber 257 50 56 364 680 316 Seed 156 45 56 257 477 220 Certified seed 153 71 70 294 900 606 Fiber and seed 265 75 63 403 723 320

North Dakota:

Fiber and seed na na na 175 180 to 316 5 to 142

na 1

In = the not two available.

Kentucky studies, fixed costs include depreciation, taxes, and insurance. In the Oregon study, fixed costs include land rent ($150), irrigation-system depreciation and interest ($44), machinery depreciation and interest, and insurance.

None of the cost estimates include costs for monitor- ing, licensing, or regulating hemp production. These external expenses would be part of the cost of produc- ing industrial hemp and could be borne by taxpayers or passed on to growers and/or processors. According to Thompson et al. (1998), Kenex Ltd. estimates that Canadian farmers will pay US$50 annually for a back- ground check and to obtain the satellite coordinates for their hemp fields (fields are monitored via satellite as part of the Canadian program).

The studies also present a range of revenue estimates, which is not surprising given the uncertainty about demand and expected market prices. Overall, it seems questionable that U.S. producers could remain prof- itable at the low end of the estimated net returns. In addition, given the thinness of the current U.S. hemp fiber market, any overproduction could lead to lower prices and lost profitability.

U.S. Experience With Kenaf and Flax

Both kenaf and flax can be legally grown in the United States. Their recent production history may lend addi- tional insights into the potential for hemp in the United States.

Kenaf is a relatively new crop. It can be grown in many parts of the United States, but it generally needs a long growing season to produce the necessary yield to make it a profitable crop. With a long growing sea-

son, like that found in the southern United States, kenaf can reach a height of 12 to 18 feet and produce 5 to 10 tons of dry fiber per acre annually. An esti- mated 8,000 acres of kenaf was grown in the United States in 1997, up from 4,000 acres in 1992 and 1993. Primary production areas are Texas, Mississippi, Georgia, Delaware, and Louisiana (Glaser and Van Dyne). Processing and product technology for kenaf- based pulp and for about six other markets have been developed, but markets must be established in each geographic area since the core fraction is very low density and expensive to ship.

Flax is grown in the United States in small quantities. Production is almost totally oilseed varieties (for lin- seed oil). Textile or linen flax has not been grown commercially in North America for 40 years (Domier). The United States does not produce textile flax for several reasons. First, the market for linen is very small compared with other natural fibers like cotton, which accounts for nearly one-third of U.S. fiber mill use. Linen textile imports have accounted for an annu- al average of 2 to 3 percent of the quantity of all fibers consumed in the United States (mill use plus net tex- tile trade). Additionally, since 1989, linen textile imports as a percentage of total textile imports have consistently fallen from 12 percent to 4 percent in 1998 and 1999. The market remains small because the economics of producing textile flax is not very price/cost competitive. As noted earlier, many ineffi- ciencies continue to exist in this industry, particularly

22 • USDA Industrial Hemp in the United States

fiber the methods of harvesting and processing. Because of

mill reopened in Quebec in December 1997, and the length of the fiber and the variation in quality, U.S.

research and development activities are occurring in mills are reluctant to use textile flax. Some recent

Alberta, Connecticut, Maine, Oregon, and developments, however, have allowed the use of tex-

Saskatchewan (Domier; Hanks, Fall 1999). tile flax waste on cotton-spinning systems. Also, a flax

Industrial Hemp in the United States USDA • 23

USDA Industrial Hemp in the United States

Conclusions
Current markets for bast fibers like industrial hemp include specialty textiles, paper, and composites. Hemp hurds, the inner woody portion of the plant stem, are used in various applications such as animal bedding, composites, and low-quality papers. As joint products, finding viable markets for both hemp bast fiber and hurds may increase the chances of a success- ful business venture. Hemp industry sources and some academic studies cite many potential uses for hemp fiber and hurds. However, for these applications to develop or expand, hemp will have to compete with current raw materials and manufacturing practices. The U.S. market for hemp fibers is, and will likely remain, a small, thin market. Changes in price or quantity could be more disruptive and have a greater adverse impact on market participants than would be the case in a larger market.

Since there is no commercial production of industrial fiber hemp in the United States, the “size” of the market can only be gauged from hemp fiber and product imports. The near-term, low-end size of the U.S. market for hemp as a textile fiber might be defined by considering the domestic production and acreage required to replace imports of hemp fiber, yarn, and fabric in 1999. Assuming a potential U.S. yield of 1,550 pounds of fiber per acre and using linen yarn and fabric conversion factors, the estimated import quantity of hemp fiber, yarn, and fabric in 1999 could have been produced on less than 2,000 acres of land. Given the average size of farms in the United States (near 500 acres), just a few farms could have supplied the hemp fiber equivalent of 1999 import levels.

As a specialty bast fiber, hemp’s closest competing textile fiber is linen. A longer term, high-end size of the potential U.S. market for hemp fiber could be defined as domestic production and acreage required to replace hemp and linen imports. The hemp fiber required to replace the equivalent level of hemp and linen fiber, yarn, and fabric imports in 1999 could have been produced on 250,000 acres—roughly 40 percent of 1999 tobacco acreage, 5 percent of U.S. oat acreage, or 0.4 percent of wheat acreage.

Despite the similarities between hemp and linen, there is no industry consensus as to how closely the markets for the two fibers are allied. But since hemp fiber imports were just 0.5 percent of linen imports during the first 9 months of 1999, the near-term market
potential for hemp in the United States for domestic textile production is closer to the low end of the 2,000- to 250,000-acre production-equivalent range. Moreover, the absence of a thriving textile flax (linen) production sector in this country (despite no legal bar- riers) suggests that hemp, flax’s close cousin in fiber uses and in production techniques, will be unable to sustain adequate profit margins for a large production sector to develop.

Thompson et al. (1998) estimate imports of hemp seed into North America at 1,300 tons. Given yields in Germany of about 1,000 pounds per acre, it would take 2,600 acres to satisfy the demand for hemp seed. As with fiber imports, it would take only a few aver- age-sized farms to meet this demand. Hemp seeds can be used directly as a food ingredient or crushed for oil and meal. Hemp seeds and flour are being used in nutrition bars, tortilla chips, pretzels, beer, salad dress- ings, cheese, and ice cream. The market potential for hemp seed as a food ingredient is unknown. However, it probably will remain a small market, like the mar- kets for sesame and poppy seeds. Some consumers may be willing to pay a higher price for hemp-seed- containing products because of the novelty, but other- wise hemp seed will have to compete on taste and functionality with more common food ingredients.

Hemp oil is being used as an ingredient in body-care products, such as lotions, moisturizers, and shampoos, and sold in health food stores as a nutritional supple- ment. The market for hemp oil is limited by a number of factors. First, mechanical crushing produces a lower oil yield than crushing combined with solvent extrac- tion. Nor does hemp oil undergo degumming and bleaching as do many other vegetable oils. Some con- sumers prefer an oil that has been processed without chemicals, but others may dislike hemp oil’s color or taste. Second, the oil is high in unsaturated fatty acids, which can easily oxidize, so it is not used for frying, must be kept in dark-colored bottles, and has a limited shelf life. Third, to be used as a salad oil, it will have to be tested by the U.S. Food and Drug Administration and found “generally recognized as safe.” Last, as a drying oil, hemp would have to compete on function- ality and price with current raw materials, such as lin- seed and tung oils, in established industrial markets.

Several States have published reports or authorized agronomic and economic feasibility studies of hemp production. The four reports summarized here have
Industrial Hemp in the United States USDA • 25
focused on different aspects of supply and/or demand. Their estimates of hemp costs and returns reflect these various focuses, as well as different assumed produc- tion practices and costs. However, the widest range of estimates exhibited among the reports is for stalk and seed yields and prices—not surprising given the uncer- tainty about hemp production and current and potential hemp markets. Overall, hemp production was prof- itable only at the higher end of estimated yields and prices. It seems questionable that U.S. producers could remain profitable at the low end of the estimated net
returns, particularly given the thinness of current U.S. hemp markets.

The market for hemp products might easily be over- supplied, as in Canada where the 35,000 acres of hemp produced in 1999 was seemingly more than the market could handle. The Minneapolis Star Tribune quotes the general manager of Kenex Ltd., Canada’s biggest hemp processor, as saying “It’s given us one hell of a glut of grain and fiber. There’s been a major overestimation of the market that’s out there” (von Sternberg).

26 • USDA Industrial Hemp in the United States

Fuels from Industrial Hemp

Biomass Fuels from Hemp - Seven Ways Around the Gas Pump
By A. Das1 and T. B. Reed2
Historically Hemp (Cannabis Sativa L.) has been a very high yielding Plant (Haney 1975). Assuming that hemp produces up to 4 tons/acre seed plus 10 tons/acre stalks. Table 1 shows how many gallons of liquid fuel import could be saved by each of the following proven conversion routes.
Table 1: Conversion technologies for hemp stalks and hemp oil Conversion technology Conversion efficiency Gasoline equivalent
% Gal/acre STALKS @ 10 tons stalks/acre 1. Ethanol fermentation of hydrolyzed cellulose 20 200 2. Digestion of whole stalks to methane 50 500 3. Producer gas from thermal Gasification of stalks 85 1000 4. Methanol from syngas from gasification of stalks 65 750 5. Wood oil from fast pyrolysis of stalks 3 30
OIL SEEDS @ 4 tons seed/acre 6. Hemp Seed oil from Seeds, no conversion 100 300 7. Biodiesel premium diesel fuel from hemp seed oil combined with methanol
90 270
Recent hemp yield data is largely unavailable, due to restrictions on the growth of hemp. Cultivation of hemp currently requires permits under Drug Enforcement Agency (DEA) form 225. Patented hemp seed varieties are now available in the EC and Eastern Europe which are effectively denatured and drug free. The hemp plant is a promising high yield biomass fuel crop cultivar and both production and utilization should be included in the DOE/TVA and regional biomass screening programs. One would hope that DOE regional biomass program contractors should not have difficulty qualifying for the necessary permits. Most of the conversion technologies in Table 1 are well known. Biodiesel from hemp is the newest conversion technology. Recently the Biomass Conference of the Americas (Biomass, 1993) had nearly a dozen papers presented on Biodiesel fuel. It was recommended that farmers in the Northwest could achieve energy self sufficiency by planting ten percent of their acreage in the oilseed crops sunflower or safflower to provide enough fuel for tractors, irrigation and combines. Sunflower and safflower yield typically 60 gallons per acre of vegetable oil. Hemp-seed yields giving up to 300 gallons of oil per acre have been reported (Haney, 1975) yet there was not one single mention of this promising fuel oilseed crop anywhere in the conference. The cost of oilseed fuels is linearly related to yield and farming cost. The cost of farming and pressing sunflower oil yielding 116 gallons/acre is $2/gallon (Peterson, 1981). Assuming that hemp will cost the same as sunflower to grow, a hemp seed yield of 4 tons/acre (Haney, 1975) produces 300 gallons of hemp seed oil at a cost of_$0.77 /gallon. This may make domestic hempseed oil fuelseed crops economically viable today.
REFERENCES:
(Biomass, 1993) Biomass Conference of the Americas, Burlington Vermont
Haney 1975 :"An ecological study of naturalized hemp (Cannabis Sativa L.) in East-Central Illinois"; Alan Haney and Benjamin B. Kutscheid: The American Midland Naturalist Vol 93, No 1, January 1975, PP 1-24
Peterson 1981: Vegetable oil as an agricultural fuel for the Pacific Northwest, C. L. Peterson, et al, Idaho Agricultural Experiment Station Bulletin No. 598, Moscow, ID 83843
1. Biomass Fuels Consultant, Original Sources, PO Box 7137, Boulder, CO 80306, (303) 225-8356
2. Thomas B. Reed, Dept. of Chemical Engineering, the Colorado School of Mines, Golden CO., 80401, 303 278 0558.

Industrial Hemp Processing Machinery

Bast Fibre Processing Pneumatic Transport and Filtration

Design and Production of :

Complete processing lines for natural fibres (flax, hemp and kenaf).

Pneumatic transport and dust extraction systems for natural and synthetic fibres, paper and card board waste, insulation material, hygienic products, wood, etc...

Engineering: A team of enthusiastic engineers for the development and innovation of all our products.

Manufacturing: Work shop with highly skilled metal workers who build the machines.

Assembly: Experienced mechanics travelling all over the world for the assembly and start up on site.

Company Structure:

Bast Fibre Processing

Flax Scutching

Core Cleaning

Pneumatic Transport Systems

Contact

4 8 10 12 16

Content

3

4

Bast Fibre Processing

Separation of fibre and core from hemp, flax or kenaf

Processing line with capacity of 6 to 8 tons per hour of raw straw at the entry of the line. A line for 3 to 4 tons per hour is also possible.

Turn key project including electrical controls, bale handling equipment, assembly of the line and start up on site

Important aspects for good processing are:

• Length of straw at entrance: Ideally 400mm (Max. 600mm)

• Moisture content: Flax and Hemp 12-18%; Kenaf 18-25%

• Straw quality: Fibre percentage of input material ±25%

• Straw condition: Slightly retted to a gold or light-grey colour

• Stalk diameter: not higher than 20mm

First section of the line: Opening & Decorticating of the straw

Output fibres with approx. 15-20% of core (‘paper quality’)

Short Fibre Baling

Online Transfer to Refining Lines

Core Buffer Container

Dust Filter Extraction

Units

Refining Lines

5

Core Cleaning

Buffer Silo for Core

Mineral Dust Treatment

Bale Opening

Dust Briquetting

Pallet Robot + Handling

Wrapping Unit

Decortication with Decorticators Section

and Fibre Balers

Fibre Separators

6

Air Separators for Pneumatic Transport & Feeding of Fibre Material

Clean Fibre Baler

Bast Fibre Processing

Further cleaning of the fibres up to a point where they contain less than 5% of core (‘technical fibres’)

The clean fibres are ready for further processing, for example in the automotive, non woven or furniture industry. New applications in composite and construction material are also gaining interest.

Online transfer from the decorticating section to several refining lines

Fibres are baled after refining

Conveyor for Manual Feeding of Fibre Bales

Entrance of Refining Lines

Hopperfeeder to Open Fibre Material and to Form a Regular Layer Towards the Refining Lines

Bast Fibre Processing

Cleaning of the core material (removal of short fibres)

The clean core can be used as stable bedding or in construction material

The wooden core of a bast plant is also called: Shives (North America), Shivs United Kingdom), Hurds (Australia), Wood (Netherlands), Anas/Chènevottes (France) or Schäben (Germany).

Pressing in bags or storage in bulk

Dust extraction for the complete line with filter units in negative pressure.

Separate treatment of mineral and organic dust.

7

8

Divider (Increase of Flax Layer Speed)

Ripping Comb for Removal of Seed Balls

Entrance of the Line (Unrolling of Flax Bales)

Scutching Turbine for Long Fibre Flax

Capacity of 3.000tons per hour (good quality flax)

The scutched flax is ready to be combed (heckled) and processed further into yarn and eventually into linen textiles.

Van Dommele builds complete scutching lines but also equipment to clean the by- products such as the core, the tow (or short fibres) and the seed.

Aspiration of Shives

Scutching Turbine

Aspiration of Tow

Primary Seed Cleaning (Shaking Unit)

Breaking Units

Scutching Elements for the Top Part of Flax Stems

Scutching Elements for the Bottom Part of Flax Stems

Transfert Unit

Exit of the Line (Final Quality Check)

Baling Press for Scutched Flax

Scutching Turbine

Differents sections in the line:

9

• Opening of the bales (+ aspiration of the seed)

• Breaking of the stems (+ aspiration of the shives)

• Scutching of the fibres (+ aspiration of the tow)

• Baling of the scutched long fibre flax

10

Core Cleaning

Removal of impurities such as short fibres, seed, dust and rocks.

Various possibilites; duvex separators, shakers, drum sieves, zig zags, etc.

Depending on the required capacity a detailed cleaning system is designed.

Removal of the dust is in many cases achieved using pneumatic transportation over air separators.

Flax Shive Cleaning Duvex Seed Separating Equipped with

System

Fibre (Fibres Exit

go to

Removal with Screw of Clean Conveyors

Shives

a Baling Press)

BigBag Filling Station for the Seed

Separating of Seed (Small Shives are Aspirated

to a Cyclone)

Inclined Shaker

Zigzag

Drum Sieve

Air Separator for Material Discharge (and Dust Removal)

3rd Edition Marijuana Markets

EXECUTIVE SUMMARY

3

r

d

Ed I T I O

Sponsored by

A N

T

IO

N

BIS A L

C

A

N

N

A

INDUSTR

Y

A

S

S O C IA N T IO

T

h

e

C

a

n

nabisIndustr

y

.o

r

g

N


SPONSORS

GANNAS:RE

INSURANCE SERVICES

Denver Relief CONSULTING

CANNASURE

Cannasure Specializes in providing insurance products and Services to the legal cannabis industry. Cannasure was started with the singular purpose of helping the legal cannabis industry secure insurance products at a reasonable cost. Cannasures management team includes some of the top insurance experts and cannabis industry experts to create the first insurance company by and for the cannabis industry.

NATIONAL CANNABIS NDUSTRY ASSOCIATION

As the only national trade association for cannabis professionals, NCIA Works to defend and advance the industry on the national stage. The mission of the National Cannabis Industry Association is to promote the growth of a responsible and legitimate cannabis industry and to work for a favorable Social, economic and legal environment for that industry in the United States.

DENVER RELIEF CONSULTING

As the premiere cannabis consulting firm, Denver Relief Consulting offers a variety of services from licensing applications and compliance audits to effective cultivation techniques. The Denver Relief Consulting team provides custom Solutions for clients throughout all stages of business development. Denver Relief Consulting specializes in license application, facility design, post-license management, vendor relations, standard operating procedures and compliance.

This is only the Executive Summary Order the full 200+ page report at ArcViewMarketResearch.com

CANNAADVISORS

CanOpy

ADVANCED CANNABIS SOLUTIONS

© 2015 The ArcView Group

SPONSORS

CANNA ADVISORS

The Canna Advisors team has direct experience winning licenses, designing facilities and managing operations in the cannabis industry since 2009. As consultants, we have designed facilities and developed procedures for the most regulated markets across the nation, winning licenses in every state in which we have engaged.

CANOPYBOULDER

CanopyBoulder is a seed-stage, mentorship-driven business accelerator for companies developing ancillary products and Services for the broadening legal cannabis industry. CanopyBoulder will select 20 startups in 2015, invest 20,000 in seed capital in each venture, surround them With expert cannabis industry advisors, and invite them to Boulder to participate in a 12-week business boot camp to jumpstart their ideas.

OTHER SPONSORS

علهما

FREEDDM | ENTERPRısEs

Rx ReLeaf MJINEWS

MARIJUANA INVESTOR NEWS

Medicina

LETTER CREDITS

FROM

Publisher ArcView Market Research

THE PUBLISHER

Executive Editor Patrick Rea

Deputy Editor Carla Ooyen

Lead Researcher Kris Lotlikar

Associate Editor Connor Link

Graphic Designer Nancy McLaughlin

Associate Researcher Andrew Livingston

DEAR READER,

It is my pleasure to present to Contributing Editors Kris Krane Steve Berg Morgan Paxhia

you The Executive Summary of the 3rd Edition of the State of the Legal Marijuana Markets report. This will give you a solid glimpse of what we Contributing Researchers

elaborate on in much more detail in Nicholas Zettell

the full report. Frances Fu Vilmarie Narloch David Cosner Cassidy West Evan Nissan

In the last year, the rise of the cannabis industry went from an interesting cocktail conversation to being taken seriously as the fastest Jared Moffat

growing industry in America. What Shea Gunther

a remarkably fast transformation! At this point, it’s hard to imagine that any serious businessperson who is paying attention hasn’t spent some time thinking about the possibilities in this market.

At ArcView, we are proud to have

Published: January 26, 2015

been part of fueling and elevating that conversation. I can’t think of a single major national media outlet that has not mentioned ArcView’s research or interviewed one of our principals in its reporting on the cannabis industry This is only the Executive Summary.

in the last year. Order the full 200+ page report at: ArcViewMarketResearch.com

© 2015 ArcView Group © 2015 ArcView Group

Well-researched market data and serious, nuanced analysis is vital for entrepreneurs and investors to navigate these fast-growing, emerging markets. As the market leader in researching and understanding the legal sale and distribution of cannabis, ArcView Market Research brings unparalleled expertise and insight to the task. As the leading national network of investors looking to capitalize on the legalization of cannabis, The ArcView Group believes the investment in quality market data and analysis will pay dividends, not only for the investors and entrepreneurs in our network but also for the industry at large.

I hope this Executive Summary gives you a glimpse into the value that the full report offers for those serious about this industry. By purchasing the full report you are not only gaining access to the thinking of some of the best business minds in the space, but you are differentiating yourself in an industry where knowledge is power and a superior understanding

of market dynamics can separate winners from losers.

Similar caliber reports in other industries run $1,500 to $3,000, but we’ve priced our report at just $495, thus making it more accessible for individuals and not just businesses. You deserve to make decisions that are based on the best available data and insider analysis.

These are exciting times, and new millionaires and possibly billionaires are about to be made, while simultaneously society will become safer and freer.

At ArcView, we believe that the development of a responsible, politically engaged, and profitable, legal cannabis industry will hasten the day when not a single adult in the world is punished for this plant.

I look forward to working with you to build the next great American industry.

Sincerely,

Troy Dayton CEO The ArcView Group

A R C V I E W ’ S H I G H L I G H T S O F T H E L E G A L C A N N A B I S I N D U S T R Y

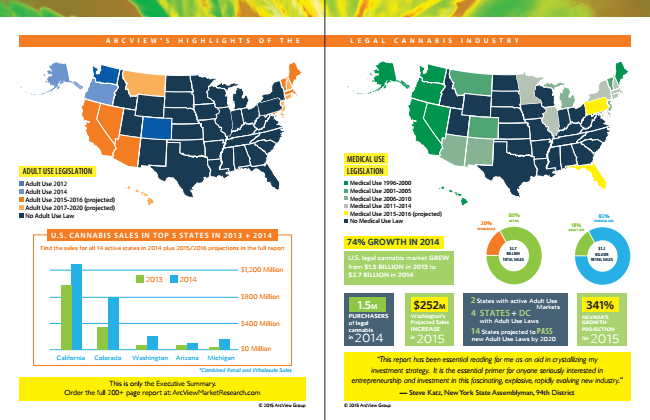
MEDICAL USE ADULT USE LEGISLATION LEGISLATION Adult Use 2012

Medical Use 1996-2000 Adult Use 2014

Medical Use 2001-2005 Adult Use 2015-2016 (projected)

Medical Use 2006-2010 Adult Use 2017-2020 (projected) No Adult Use Law

Medical Use 2011-2014 Medical Use 2015-2016 (projected)

80% No Medical Use Law

20%

Retail

Wholesale

$1.2 U.S. legal cannabis market gReW

BILLION RETAIL SALES from $1.5 billioN in 2013 to $2.7 billioN in 2014

2

States with active Adult Use 4 STATES + DC

Markets

with Adult Use Laws 14

States projected to

82% 18%

Medical Use

U.S. CANNABIS SALES IN TOP 5 STATES IN 2013 + 2014

Find the sales for all 14 active states in 2014 plus 2015/2016 projections in the full report

74% gRoWth iN 2014

adUlt Use

$2.7 BILLION TOTAL SALES $1,200 Million 2013 2014

$800 Million

1.5

M

$252

M

341% pURchaseRs

Washington’s

Nevada’s $400 Million

of legal

Projected Sales

gRoWth cannabis in

2014

iNcRease in

PASS new Adult Use Laws by 2020 $0 Million California Colorado Washington Arizona Michigan

“This report has been essential reading for me as an aid in crystallizing my investment strategy. It is the essential primer for anyone seriously interested in entrepreneurship and investment in this fascinating, explosive, rapidly evolving new industry.” — Steve Katz, New York State Assemblyman, 94th District

pRojectioN

for

2015

*Combined Retail and Wholesale Sales

2015

This is only the Executive Summary. Order the full 200+ page report at: ArcViewMarketResearch.com

© 2015 ArcView Group © 2015 ArcView Group

TABLE OF CONTENTS FOR THE FULL REPORT

1. ExEcutivE Summary

2. mEthodology & acknowlEdgEmEntS

2.1. Acknowledgments

2.2. Methodology

2.3. Disclaimers and Other Information

2.4. Disclosures

3. national markEt

3.1. Overview

3.1.1. Current Market Legalization

3.1.2. Potential Market Legalization

3.1.3. National Market Growth Risk Factors

3.2. History of the Market

3.3. Addressable Market

3.3.1. Medical Use

3.3.2. Adult Use

3.4. Value Chain

3.4.1. Pricing Dynamics

3.5. Growth in Industry Participation

3.6. National Market Sentiment

3.7. National Advocacy

3.7.1. National Policy & Industry Groups

3.7.2. Trade Association Profile: NCIA, Michael Corriera

3.8. Regulatory & Legal Framework

3.8.1. Federal

3.8.2. Politician Profile: Representative Earl Blumenauer

3.8.3. States

3.8.4. Managing Business Legal Risk

3.8.5. Company Profile: GreenBridge Corporate Council, Khurshid Khoja

3.8.6. Legal Market vs. Black and Gray Markets

3.9. Product Regulation and Standards

4. StatE markEtS

4.1. Overview

4.2. Established Markets

4.2.1. Arizona

4.2.2. California

4.2.3. Colorado

4.2.4. Connecticut

4.2.5. Illinois

4.2.6. Maine

4.2.7. Massachusetts

4.2.8. Michigan

4.2.9. Nevada

4.2.10. New Jersey

4.2.11. New Mexico

4.2.12. Oregon

4.2.13. Rhode Island

4.2.14. Vermont

4.2.15. Washington

4.2.16. Company Profile: Trevor Steinthal,Suncliff

4.2.17. Washington DC

4.3. Emerging Markets

4.3.1 Alaska

4.3.2. Delaware

4.3.3. Hawaii

4.3.4. Maryland

4.3.5. Minnesota

4.3.6. Montana

4.3.7. New Hampshire

4.3.8. New York

4.4. CBD Only States

This is only the Executive Summary. Order the full 200+ page report at: ArcViewMarketResearch.com

“With marijuana now legal for medical use in 23 states and Washington, D.C., and full legalization heading to the ballot in Alaska and Oregon, the size of the noncriminal marijuana industry is expected to grow to about $2.6 billion this year from about $1.5 billion last year, according to estimates by the ArcView Group, a marijuana research and investment firm in San Francisco.”

— The New York Times, “Next Gold Rush: Legal Marijuana Feeds Entrepreneurs’ Dreams” 7/22/14

© 2015 ArcView Group © 2015 ArcView Group

6. TABLE OF CONTENTS FOR THE FULL REPORT

ancillary BuSinESSES

6.1. Overview 5. markEt trEndS

6.2. Advisory Services 5.1. Alternative Ingestion Methods

6.2.1. Company Profile: Canna Advisors, Jay Czarkowski 5.1.1. Edibles

6.2.2. Company Profile: Bulbulyan Consulting Group, Avis Bulbulyan 5.1.2. Topicals

6.2.3. Company Profile: MJArdin, James Lowe 5.1.3. Extractions

6.3. Information Technology 5.1.4. Cannabidiol (CBD)

6.3.1. Consumer Facing 5.2. Product Testing

6.3.2. Business Management 5.2.1. Company Profile: CannLabs, Genifer Murray

6.3.3. Company Profile: Isaac Deiderich, MassRoots 5.3. Branding

6.3.4. Company Profile: Keith McCarty, Eaze 5.3.1. Company Profile: Luke Zimmerman, The Law Offices of Luke S. Zimmerman APC

6.3.5. Company Profile: Zachary Marburger, Cannabuild/Whaxy 5.4. Multistate Licensing

6.4. Insurance Services 5.4.1. Company Profile: Auntie Dolores, Julianna Corella

6.4.1. Company Profile: Cannasure Insurance, Pat McManamon 5.5. Reverse Mergers

6.5. Education 5.5.1. Company Profile:Tom Bollich, Surna

6.6. Other Ancillary Businesses 5.6. Changing Landscape of Cultivation

6.6.1. Security Services 5.6.1. Large Scale Production

6.6.2. Company Profile: Canna Security America, Dan Williams 5.6.2. Company Profile: Nick Hice, Denver Relief

6.6.3. Consumption Devices 5.7. Real Estate

6.6.4. Media 5.8. Cannatourism

6.6.5. Events 5.9. Growth in Nontraditional Consumers

7. invEStmEnt & FinancE 5.10. The Intersection of Advocacy and Entrepreneurship

7.1. Overview 5.11. Diversity in the Industry

7.2. Investment Types 5.11.1 Potential for Greater Diversity

7.3. Key Investment Considerations 5.11.2 Q&A with Women in the industry

7.3.1. Angel Investment 5.12. Consumer Education

7.3.1. Company Profile: ArcView Group 5.13. Lottery vs. Merit vs. Open

7.3.1. Individual Investor Profile: Lori Ferrara

7.3.2. Private Equity, Venture Capital Investment, and Hedge Funds

7.3.1. Company Profile: Dutchess Capital, Doug Leighton

7.3.2. Company Profile: Poseiden Asset Management: Morgan and Emily Paxhia

7.3.3. Public Markets

7.3.4. Banking and Finance

This is only the Executive Summary. Order the full 200+ page report at: ArcViewMarketResearch.com

“ArcView Group, a San Francisco-based investor network focused on the cannabis industry, estimates that the national legal marijuana market will grow 64% to $2.34 billion in 2014 and will reach $10.2 billion in five years.” — Wall Street Journal “Entrepreneurs Seek Profits From Pot” 2/3/14

© 2015 ArcView Group © 2015 ArcView Group

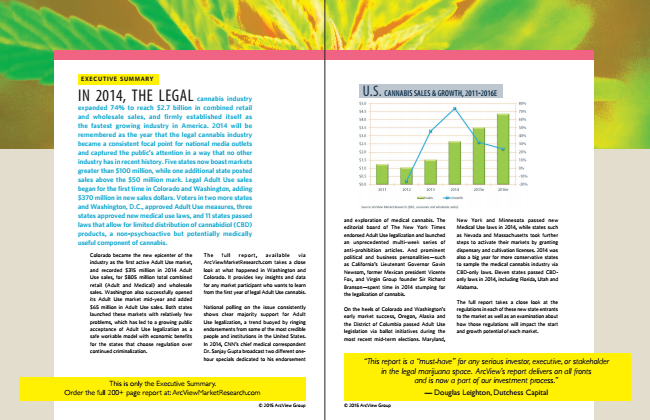
EXECUTIVE SUMMARY IN 2014, THE LEGAL

cannabis industry

U.S.

CANNABIS SALES & GROWTH, 2011-2016E

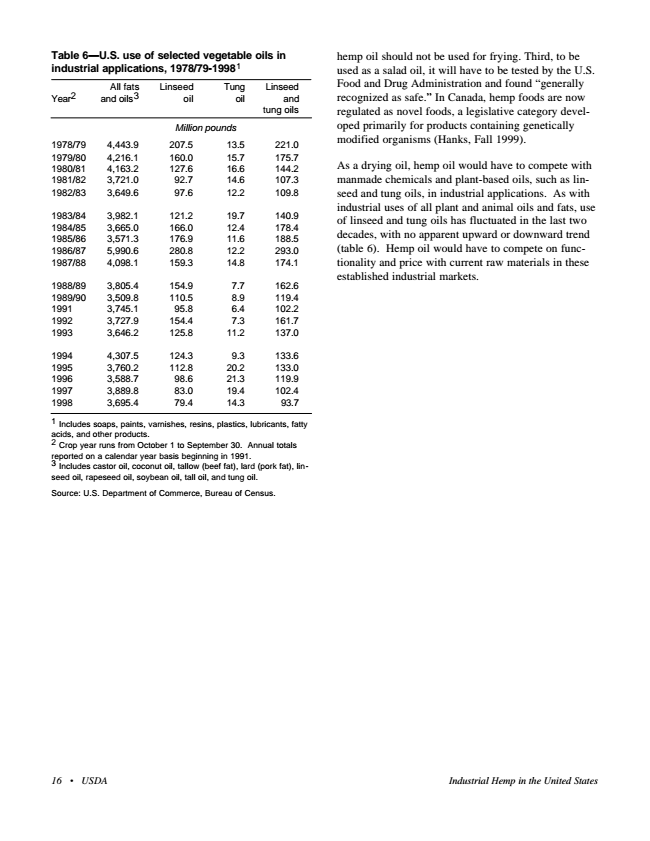
expanded 74% to reach $2.7 billion in combined retail and wholesale sales, and firmly established itself as the fastest growing industry in America. 2014 will be remembered as the year that the legal cannabis industry became a consistent focal point for national media outlets and captured the public’s attention in a way that no other industry has in recent history. Five states now boast markets greater than $100 million, while one additional state posted sales above the $50 million mark. Legal Adult Use sales began for the first time in Colorado and Washington, adding $370 million in new sales dollars. voters in two more states and Washington, D.C., approved Adult Use measures, three states approved new medical use laws, and 11 states passed laws that allow for limited distribution of cannabidiol (CbD)

and exploration of medical cannabis. The editorial board of The New York Times products, a non-psychoactive but potentially medically

endorsed Adult Use legalization and launched useful component of cannabis.

an unprecedented multi-week series of

Colorado became the new epicenter of the

The full report, available via industry as the first active Adult Use market,

ArcViewMarketResearch.com takes a close

anti-prohibition articles. And prominent political and business personalities—such as California’s Lieutenant Governor Gavin and recorded $315 million in 2014 Adult

look at what happened in Washington and Use sales, for $805 million total combined

Colorado. It provides key insights and data retail (Adult and Medical) and wholesale

for any market participant who wants to learn

Newsom, former Mexican president Vicente Fox, and Virgin Group founder Sir Richard Branson—spent time in 2014 stumping for sales. Washington also successfully opened

from the first year of legal Adult Use cannabis. its Adult Use market mid-year and added

the legalization of cannabis.

$65 million in Adult Use sales. Both states

National polling on the issue consistently

On the heels of Colorado and Washington’s launched these markets with relatively few

shows clear majority support for Adult problems, which has led to a growing public

Use legalization, a trend buoyed by ringing acceptance of Adult Use legalization as a

endorsements from some of the most credible

early market success, Oregon, Alaska and the District of Columbia passed Adult Use legislation via ballot initiatives during the safe workable model with economic benefits

people and institutions in the United States. for the states that choose regulation over

In 2014, CNN’s chief medical correspondent

most recent mid-term elections. Maryland,

continued criminalization.

Dr. Sanjay Gupta broadcast two different one- hour specials dedicated to his endorsement

This is only the Executive Summary. Order the full 200+ page report at: ArcViewMarketResearch.com

© 2015 ArcView Group © 2015 ArcView Group

“This report is a “must-have” for any serious investor, executive, or stakeholder in the legal marijuana space. ArcView’s report delivers on all fronts and is now a part of our investment process.” — Douglas Leighton, Dutchess Capital

New York and Minnesota passed new Medical Use laws in 2014, while states such as Nevada and Massachusetts took further steps to activate their markets by granting dispensary and cultivation licenses. 2014 was also a big year for more conservative states to sample the medical cannabis industry via CBD-only laws. Eleven states passed CBD- only laws in 2014, including Florida, Utah and Alabama.

The full report takes a close look at the regulations in each of these new state entrants to the market as well as an examination about how those regulations will impact the start and growth potential of each market.

This is only the Executive Summary. Order the full 200+ page report at: ArcViewMarketResearch.com

Investment activity and business interest in the legal cannabis industry surged, with virtually every business-to-business event registering record attendance and unparalleled media interest. At the same time, The Department of Justice (DOJ) announced a policy shift aimed to encourage banks to accept cannabis-related business accounts, and Congress passed a law that prohibits the use of federal funds to prosecute people who follow their state’s medical cannabis laws. The DOJ also issued a memo in late December to allow Native American tribes to grow and sell marijuana within their territories as long as they follow established federal guidelines.

The industry suffered a few setbacks in 2014, but these were minimal compared to the market contraction and uncertainty that a much more nascent industry withstood in 2011 and 2012 as a result of various federal attacks and unfavorable industry press. Michigan once again failed to approve legislation to provide a dispensary structure to its medical cannabis law, and Florida’s landmark medical cannabis vote failed to pass the 60% supermajority test by a mere 2%. Montana continues to battle out the future of its medical market in its courts, and California’s regulatory structure continues to limit its market potential. Controversy over the license selection process has led to a delay in cannabis businesses opening in Massachusetts, while Illinois failed to meet its own deadline to approve dispensary and cultivation licenses. Though the DOJ attempted to give banks the go-ahead

to work with cannabis businesses, very few banks have followed through on the opportunity, so many finance issues persist in the absence of an official change to federal law. And in what legal experts consider to be an impractical move, Nebraska and Oklahoma filed suit against their neighboring state of Colorado, alleging that legal cannabis from Colorado floods their counties and taxes local law enforcement resources. On the tech front, many marijuana businesses have been prevented from establishing a strong online presence because of interference from large tech providers. Apple, for one, disallows most marijuana-related apps in its App Store, and Facebook decided in 2015 to close accounts that primarily post marijuana-related content on its main site or its photo-sharing app Instagram. This trend dramatically increases the relevance of dedicated cannabis social media and information providers.The biggest drawback for the industry is that cannabis remains illegal under federal law. The Drug Enforcement Agency still categorizes marijuana as a Schedule 1 controlled substance, which means the federal government considers it to be as dangerous as heroin, with no medical use and high potential for abuse. Nearly 700,000 people were arrested on cannabis charges in 2013 and thousands languish in prison with vastly disproportionate enforcement among the poor and people of color.

ArcView Market Research (AMR)—alongside many executives, investors, entrepreneurs and thought leaders interviewed for this report—

“The quality of content in the report shows that this group is clearly staying on the forefront of the industry.” — Emily Paxhia, Poseidon Asset Management

© 2015 ArcView Group © 2015 ArcView Group

believes that 2014 will be remembered as a year when industry experienced its most significant maturation to date and when a sense of inevitability about national legalization became conventional wisdom among elected officials and the general public.

The revolutions of 2014 did not go unnoticed by business leaders who may carry the industry into mainstream acceptance. Not two weeks into 2015, the Peter Thiel-led Founders Fund announced a multimillion-dollar investment in Privateer Holdings, an early industry venture capital fund that, among other deals, has signed with Bob Marley’s
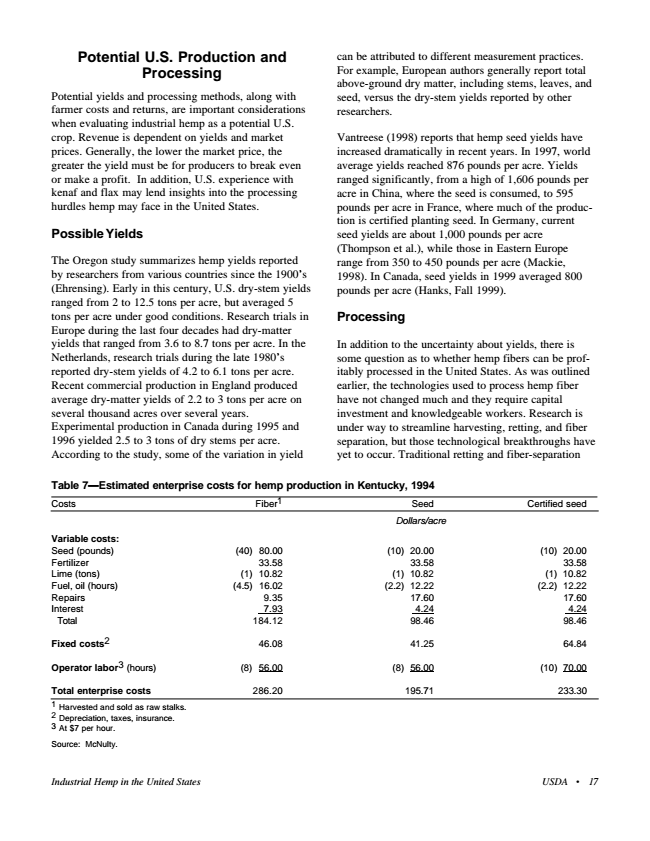
$2.7

BILLION U.S. CANNABIS SALES BY STATE IN 2014

estate to launch a national cannabis brand called Marley Natural. The cannabis industry will become less fragmented as strong business leaders work together with advocacy groups and regulators to build strong regulatory structures, expand legal markets, and use critical investment dollars to support the development of market-leading brands.

2014 was a year full of bellwether moments and 2015 is expected to continue on the same path. But ArcView Market Research believes 2016 could be an even more significant year for the cannabis industry, cementing the industry’s rightful place

U.S. in the U.S. health, wellness and business

new laws and when each would pass. Market

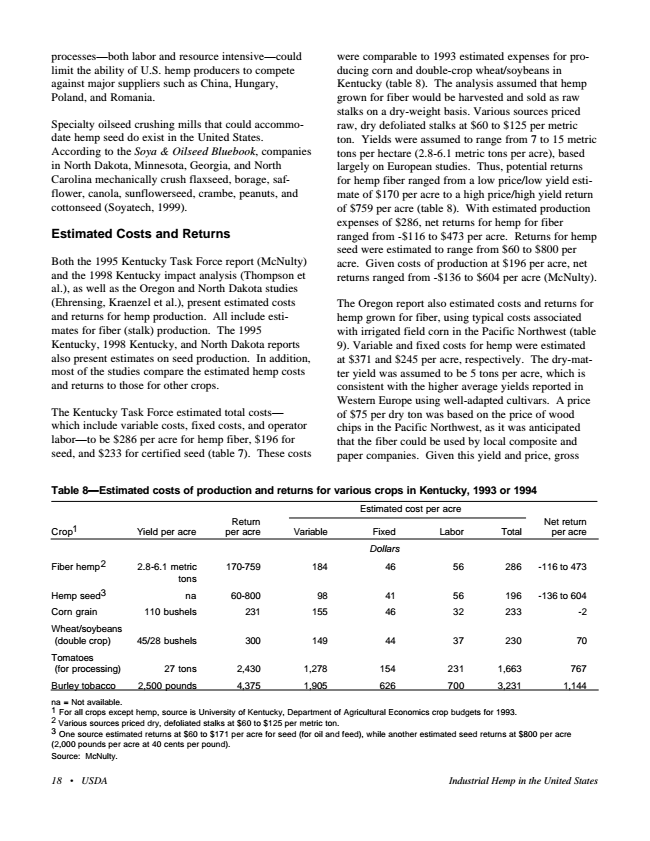
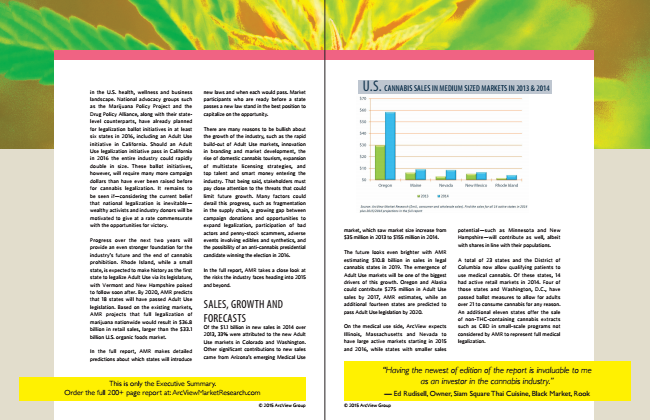
CANNABIS SALES IN MEDIUM SIZED MARKETS IN 2013 & 2014

landscape. National advocacy groups such

participants who are ready before a state as the Marijuana Policy Project and the

passes a new law stand in the best position to Drug Policy Alliance, along with their state-

capitalize on the opportunity. level counterparts, have already planned for legalization ballot initiatives in at least

There are many reasons to be bullish about six states in 2016, including an Adult Use

the growth of the industry, such as the rapid initiative in California. Should an Adult

build-out of Adult Use markets, innovation Use legalization initiative pass in California

in branding and market development, the in 2016 the entire industry could rapidly

rise of domestic cannabis tourism, expansion double in size. These ballot initiatives,

of multistate licensing strategies, and however, will require many more campaign

top talent and smart money entering the dollars than have ever been raised before

industry. That being said, stakeholders must for cannabis legalization. It remains to

pay close attention to the threats that could be seen if—considering the current belief

limit future growth. Many factors could that national legalization is inevitable—

derail this progress, such as fragmentation wealthy activists and industry donors will be

in the supply chain, a growing gap between motivated to give at a rate commensurate

campaign donations and opportunities to with the opportunities for victory.

expand legalization, participation of bad actors and penny-stock scammers, adverse Progress over the next two years will

events involving edibles and synthetics, and provide an even stronger foundation for the

the possibility of an anti-cannabis presidential industry’s future and the end of cannabis

candidate winning the election in 2016. prohibition. Rhode Island, while a small state, is expected to make history as the first

In the full report, AMR takes a close look at state to legalize Adult Use via its legislature,

the risks the industry faces heading into 2015 with Vermont and New Hampshire poised

and beyond. to follow soon after. By 2020, AMR predicts that 18 states will have passed Adult Use legislation. Based on the existing markets,

SALES, GROWTH AND AMR projects that full legalization of marijuana nationwide would result in $36.8 billion in retail sales, larger than the $33.1

© 2015 ArcView Group © 2015 ArcView Group FORECASTS Of the $1.1 billion in new sales in 2014 over

billion U.S. organic foods market.

2013, 33% were attributed to the new Adult Use markets in Colorado and Washington.

In the full report, AMR makes detailed

Other significant contributions to new sales

predictions about which states will introduce

came from Arizona’s emerging Medical Use

market, which saw market size increase from $35 million in 2013 to $155 million in 2014.

The future looks even brighter with AMR estimating $10.8 billion in sales in legal cannabis states in 2019. The emergence of Adult Use markets will be one of the biggest drivers of this growth. Oregon and Alaska could contribute $275 million in Adult Use sales by 2017, AMR estimates, while an additional fourteen states are predicted to pass Adult Use legislation by 2020.

On the medical use side, ArcView expects Illinois, Massachusetts and Nevada to have large active markets starting in 2015 and 2016, while states with smaller sales

potential—such as Minnesota and New Hampshire—will contribute as well, albeit with shares in line with their populations.

A total of 23 states and the District of Columbia now allow qualifying patients to use medical cannabis. Of these states, 14 had active retail markets in 2014. Four of those states and Washington, D.C., have passed ballot measures to allow for adults over 21 to consume cannabis for any reason. An additional eleven states offer the sale of non-THC-containing cannabis extracts such as CBD in small-scale programs not considered by AMR to represent full medical legalization.

This is only the Executive Summary. Order the full 200+ page report at: ArcViewMarketResearch.com

“Having the newest of edition of the report is invaluable to me as an investor in the cannabis industry.” — Ed Rudisell, Owner, Siam Square Thai Cuisine, Black Market, Rook

NATIONAL PROGRESS On the national front, small changes continue to point toward a slow incremental federal exit from cannabis prohibition. In 2013, a memorandum from Deputy Attorney General James Cole formally set a pro-cannabis tone for the U.S. Department of Justice’s involvement in states’ jurisprudence over their own cannabis laws. Under the memo, prosecutors were guided not to base prosecutions on the size of commercial cannabis operations alone. Raids on dispensaries and grow operations dropped dramatically in 2014, suggesting that most in the federal government took the Cole Memo to heart. Then, in February 2014, guidance from the U.S. Treasury Department and the DOJ indicated that banks that offer financial services to cannabis based businesses in legalized states would not be punished if both the bank and its clients follow the basic business tenets set forth by the Cole Memo, as well as specific reporting requirements and due diligence expectations.

In the biggest federal win for the cannabis legalization movement in history, a rider in a December 2014 Congressional “cromnibus” spending bill passed and effectively eliminated the federal government’s fiscal capacity to interfere with states in their implementation and oversight of medical cannabis laws. The same spending bill, however, may impede the District of Columbia’s ability to enact Adult Use cannabis laws through much of 2015.

The continued success of the state markets has created the public perception that nationwide legalization is inevitable. This

trend—compounded with the loss of big name

one another and funding the greatest year

later in the year because of SEC actions and political donors, such as Peter Lewis and John

of expansion the legal cannabis industry has

a market that became wise to penny stock Sperling—has created a political funding crisis.

ever seen.

pump-and-dump schemes. In the full report, ArcView Market Research takes a closer look STATE MARKETS

Heavy investment activity has been directed

at the public stock roller coaster ride of 2014 to new dispensaries, commercial cultivation

to provide insights about what to look out for Each state market remains unique and

operations, manufacturers of infused

in 2015 as the industry matures. fractured, though certain regulatory trends

products, and ancillary products and services. have begun to emerge among newly regulated

In Colorado alone, industrial real estate is

Cannabis’s federal designation as a Schedule states. Lessons learned from the fast-growing

increasingly difficult to find, thanks to newly

1 drug remains the greatest barrier to and relatively efficiently regulated Adult Use

created (or expanding) cannabis businesses.

the entrance of institutional finance and market of Colorado have begun to inform the

investment groups in the cannabis industry. development of Adult Use and Medical Use

In the last two years, The ArcView Group,

In general, banks insured by the FDIC will not laws in newly opened states. Washington’s

the publisher of this report and the largest

lend openly to companies that profit from the adult use market—slightly more restrictive in

cannabis investment network, expanded its

plant for fear of federal repercussion. scope than Colorado’s—lags the Centennial

membership from 30 to over 400 accredited state by about one year, but it should provide

investor members who have invested more

“My company does tens of millions of dollars an instructive counterpoint in its regulatory

than $20 million into cannabis-related start-

of business a year and can’t get a $10,000 line scheme. Emerging markets in eastern states

ups. Also, non-cannabis investment events

of credit from a bank,” says Steve DeAngelo, favor regulatory and licensing structures used

began including programming about the

CEO of one of the largest medical cannabis in states such as Maine.

cannabis industry. Even CNBC’s popular

retailers, Harborside Health Center. segment Power Pitch has included some The largest medical market in the country,

cannabis-related start-ups.

Other challenges to investment include California, is no longer a model for medical

not-for-profit requirements in some states, cannabis legalization because of its lack of

In the full report, AMR takes a look at some of

ownership transfer limitations in others, statewide regulation. Arizona, on the other

the companies who have successfully raised

and in-state residency requirements and hand, will be the state to watch in 2015. Its

capital and the investors who have participated

disclosure requirements. market grew more than 300% last year—the

in these deals. AMR also examines the highest sales growth of any state in 2014.

different types of investment structures that

The lack of institutional capital available to have emerged in this unique market.

cannabis businesses that work directly with Sales and growth data and forecasts for 2015

the plant has created opportunities for the and 2016 are available for all active states in

The public markets saw a massive influx of

hundreds of individual investors and smaller the full report.

companies that seek to capitalize on investor

venture funds making inroads to cannabis. interest in the new sector. The number of

Some of these same investors play in ancillary FINANCE & INVESTMENT

public cannabis companies skyrocketed at

products and services. the beginning of 2014 and then plummeted Federal prohibition has not slowed investment interest in cannabis. Financiers and entrepreneurs have succeeded in finding

“I find this report absolutely invaluable. The breadth of coverage of multiple market segments and insights

This is only the Executive Summary. Order the full 200+ page report at: ArcViewMarketResearch.com

into geographically specific issues will support very focused targeting and analysis of opportunities.” — Steve Trenk, Lizada Capital

© 2015 ArcView Group © 2015 ArcView Group

Share This

Organization and Social Sites